The Loma Prieta Earthquake which is also known as the World Series Earthquake, struck the San Francisco Bay area on October 17, 1989. We will use this event to study seismograms, earthquakes and to cover California geology to study for this segment.
A seismogram is the record written by a seismograph (pictured above) in response to ground motions produced by an earthquake, explosion or other ground-motion sources. Earthquakes cause both vertical and horizontal ground motion. Surface waves and body waves are important in our understanding and reading of seismograms.
A seismogram is the record written by a seismograph (pictured above) in response to ground motions produced by an earthquake, explosion or other ground-motion sources. Earthquakes cause both vertical and horizontal ground motion. Surface waves and body waves are important in our understanding and reading of seismograms.
Surface and Body Waves used to locate distance and epicenters.
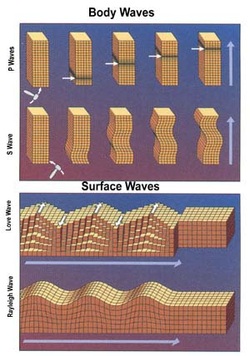
Surface waves travel along the outer part of Earth. These waves move in rolling motions (Rayleigh waves) such as ocean waves and also side to side motion (L[ove] waves) that parallel Earth's surface. These waves are slower than body waves and diminish as they get further from the surface.
Body Waves travel in Earth's interior and are refracted by varying density and stiffness underground. The effect is similar to the refraction of light waves which also vary according to temperature and composition. These waves are divided into two types called primary (P) waves and secondary (S) waves. Both are defined according their mode of propagation. P waves push and pull rocks in the direction the wave is travelling. Solids, liquids and gases underground affect the waves when compressed, therefore P waves can travel through all these materials. S waves, on the other hand shake particles at a right angle to their direction of travel and travel more slowly than P waves. These waves only transmit through solids as liquids and gases do not resist changes in shape. The farther body waves travel form an earthquake focus, the farther behind the S-waves get. It is this lag in time between the arrival of P-waves and the first S-waves that is important in locating epicenters. The location of an epicenter can be anywhere for a single observer but precise location can be found with three or more seismic stations.
{The Loma Prieta earthquake lasted 10 to 15 seconds and caused a section of the Cypress double deck freeway to fall. Surface waves hit this section of the freeway which was built on top of a filled marshland causing liquefaction to occur and collapsed the structure.}
Sample Question: If a primary wave travels at a rate of 6km/s through continental crust, how long will it take it to reach a seismic station located 1,200 km away?
Intensity and Magnitude
The Loma Prieta earthquake measured 7.1 on the surface-wave magnitude and 6.9 on the moment magnitude scale, it had an intensity of up to 10. Seismograms are helpful in determining magnitude and intensity. Magnitude measures the energy released at the source of the earthquake. Intensity measures the strength of shaking produced by the earthquake at a given location (varies with distance) determined by the effects on people, human structures and environment. The Richter Magnitude scale assigns a single number to quantify the energy contained in an earthquake. Surface-wave magnitude and body-wave magnitudes are ways of measuring earthquakes but most common use is given to the moment magnitude scale. Surface-wave magnitude as reported for the Loma Prieta earthquake is still used because it can be calculated quickly. Moment magnitude scales measure the energy released of earthquakes and as I said before is now the scale used to estimate magnitudes for all modern large earthquake. Intensity estimation can be traced back to earlier methods of observation but people's account varied widely, making an accurate measurement difficult. The Mercalli Intensity Scale measures the effect of an earthquake at a particular locale. Therefore, an earthquake may have a single magnitude reading but varying intensity effect. Factors affecting intensity include distance from epicenter, surface materials, and building designs. A 7.3 earthquake in Honduras (2009) caused lesser damage in comparison to a smaller 7.0 Haitian earthquake (2010) but with higher intensity of IX. The Hatian event occurred right under their feet while the Honduran shake was out at sea.
Focal Mechanisms

Seismologists refer to the direction of slip in an earthquake and the orientation of the fault on which it occurs as the focal mechanism. Seismograms around an earthquake are used to calculate the focal mechanism and use symbols that resemble a beachball to display it on maps. Seismic waveforms are observed which reveal patterns of first waves (P-waves). Motions of these waves are checked for each seismograph station to see if it's pushing (upward and away from source) or pulling (downward and towards the source). Pushing is compression and pulling is tension. Think of it in terms of energy released and how it radiates outwardly (pushing/compression) or inwardly (pulling/tension). This motion information is reported on half spheres (A on diagram) showing what direction seismic waves traveled as they left the quake focus. The half sphere that you see on the diagram to the left (A) shows an equal area projection of seismic movement. The shaded areas represent compression (outward) and the white areas represent tension (inward movement). The strike slip, represented by the beach ball under B, shows a normal earthquake where compressions and tensions are opposite each other and equally divided on the circle. The fault that created the push and pull runs exactly between the shaded and white areas and solid motion (rocks) goes from white to grey. The P and T labels relate to maximum tension (P) and maximum compression (T) which are used for mathematical descriptions for the quake motions.
Given my explanations, do you think that if given a beachball symbol as a test question, you would be able to tell direction of slip and orientation of fault?
Given my explanations, do you think that if given a beachball symbol as a test question, you would be able to tell direction of slip and orientation of fault?
You might be given a map like this to decipher:

One test question that you might see as a written response will be topographic map with different symbols just like the one on the left (without the key of course!). Make sure that you prepare to respond to something like this by looking up how topographic maps are drawn and symbols used for depressions, ridges, faults (slip, strike,divergent etc.), water, elevation and others not shown here.
